Overall Analysis
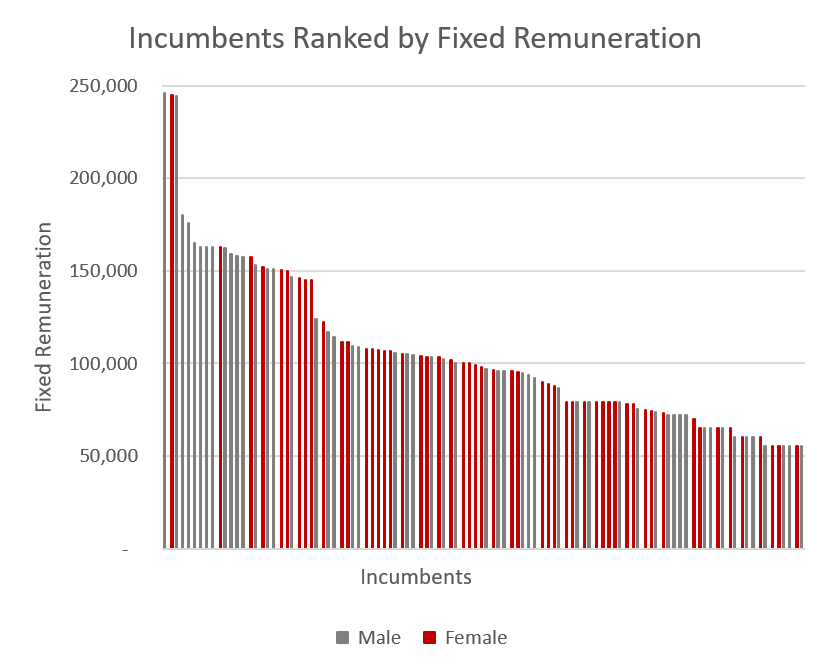
As a starting point, Reward Results can rank each incumbent in your organisation by their fixed remuneration. When colour coded by gender, this provides an at-a-glance understanding of the relationship between gender and pay within your organisation.
In the hypothetical example to the left, it is clear that males are employed more predominantly in higher paid roles, suggesting an issue of representation.
“Like-for-like” Comparison Analysis
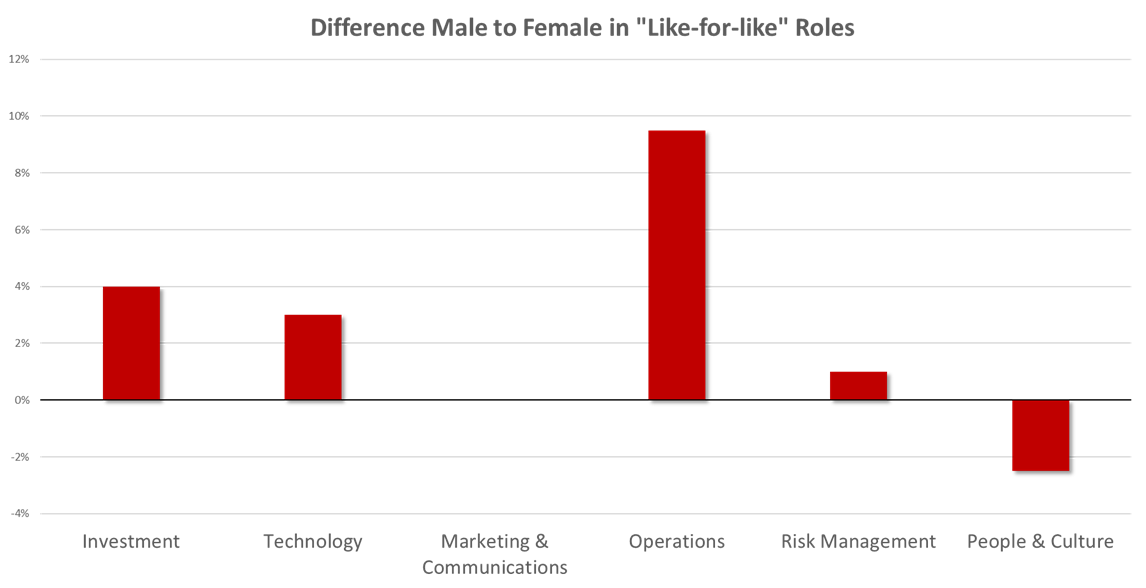
A ‘true’ gender pay gap exists when males and females are paid differently for the same role. This can be identified using a “Like-for-Like” comparison.
This would involve determining the median fixed and variable remuneration of all males and all females that share a job .
Using salary survey information that you have Reward Results would provide a list of each job code and the gender based medians for each.
In this hypothetical example to the right, there is a minor pay bias towards females, which is more significant in some departments, such as Operations.

Broader Market Comparisons
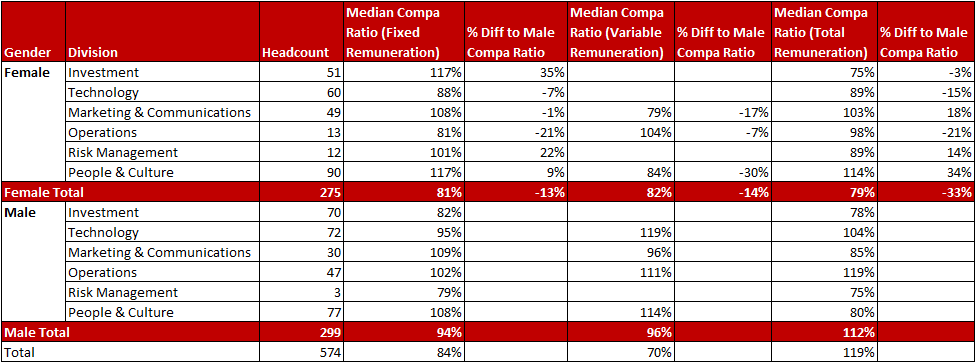
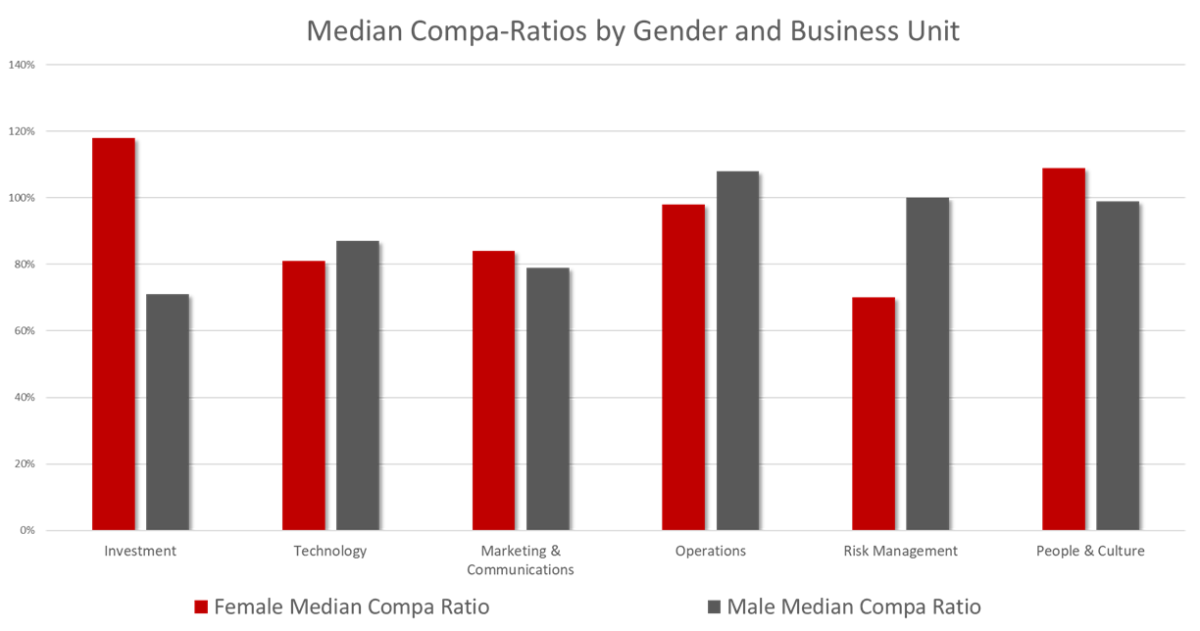
To further determine if there is a ‘true’ gender pay gap, Reward Results would compare each employee’s remuneration with your external survey equivalent for their role, to find a compa-ratio.
This comparison to the broader market, or a specific peer group, would allow us to identify if there is a gendered pay discrepancy in any specific business unit.
An example of how this data could be presented is provided to below.
Job Size Analysis
A lack of a true gender pay gap does not preclude other forms of systemic gender bias, such as the ‘glass ceiling’/’sticky floor’ effects.
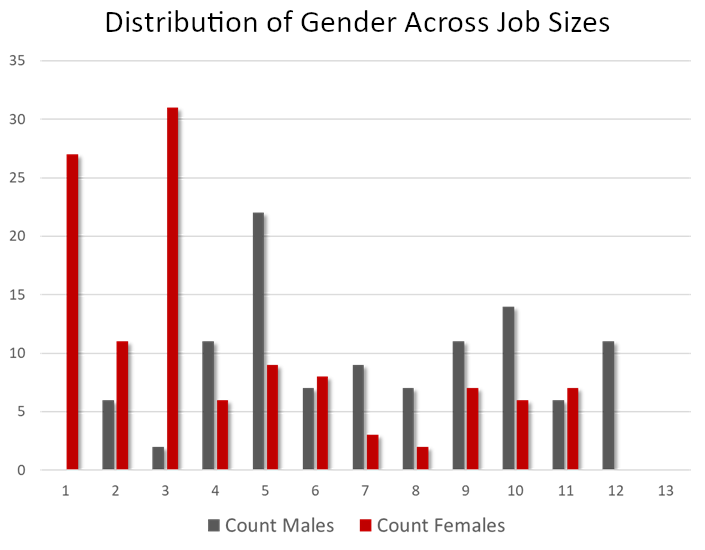
By comparing the distribution of gender across job sizing we can identify if there is a gender bias in seniority.
In this example, our hypothetical company has more junior roles (e.g. size 1-3) populated by females, while males tend to occupy more senior roles.
Age and Tenure Analysis
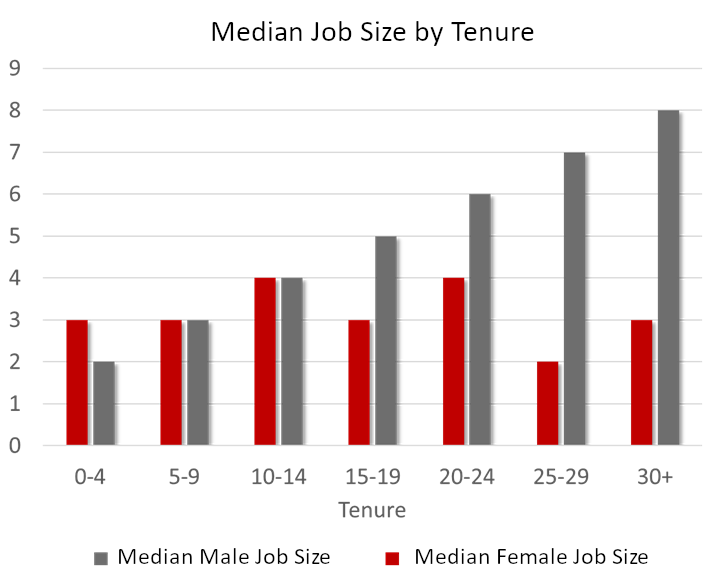
To gain further context, we can examine the relationship between gender, tenure, and job size.
A potential gender seniority bias is revealed if those with a longer tenure have a smaller job size than the opposite gender.
In this example, it would appear that females are less likely to be promoted than their male peers as their tenure increases.
Summary
Reward Results can provide bespoke Diversity Analysis including:
- General Gender Pay Gap Analysis
- Broader Market Comparisons
- Peer Group Comparisons
- “Like-for-like” role Analysis
- Job Size Analysis
- Age and Tenure Analysis
- Executive Pay Analysis
- Divisional/Team Analysis
- Analysis for any other variable for which data is available.
